The one thing that misleads people
These are ensemble means, and a mean smooths systems away. At a week
out, a mean showing a shallow 1000 hPa low does not mean the models forecast a weak
low. It far more often means fifty members put a deep low in fifty different places,
and averaging them flattened it. Read the mean for the pattern — where the
ridge is, where the trough is, which way the flow runs — and never as a system with a
position and a depth.
That is what the spread fields are for. Where spread is high, the mean is an average
of disagreement rather than a forecast.
Pressure and the flow above it
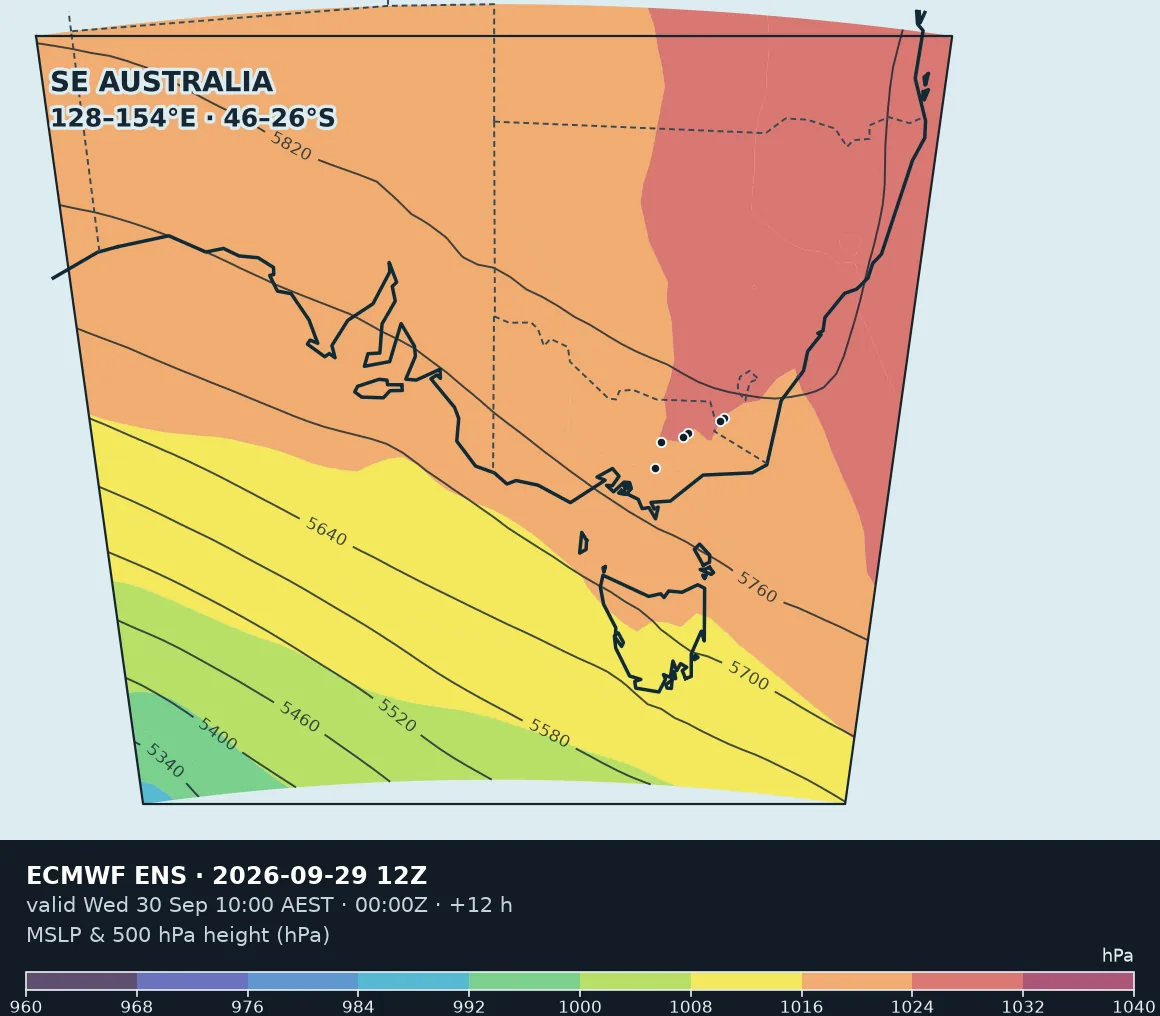
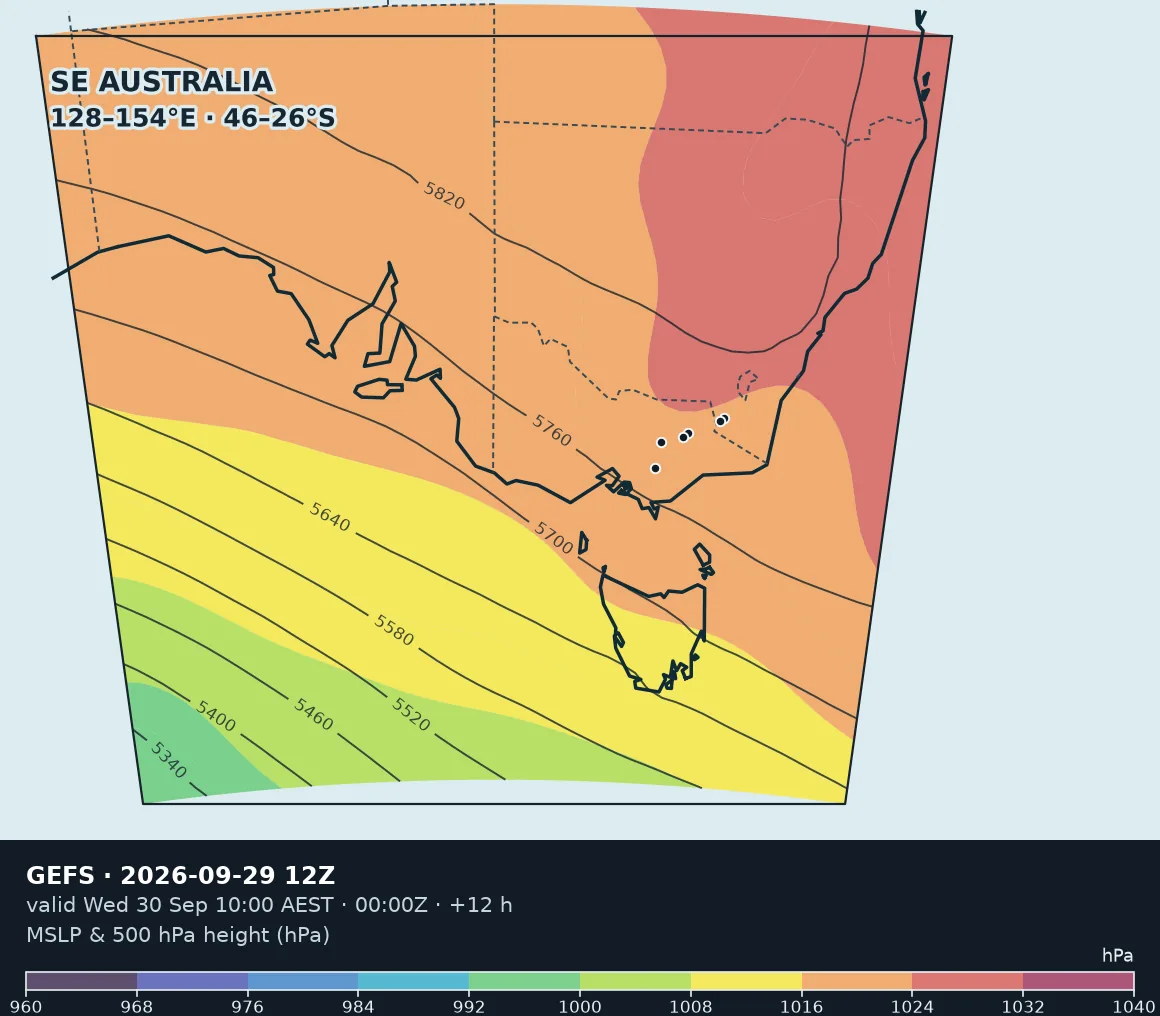
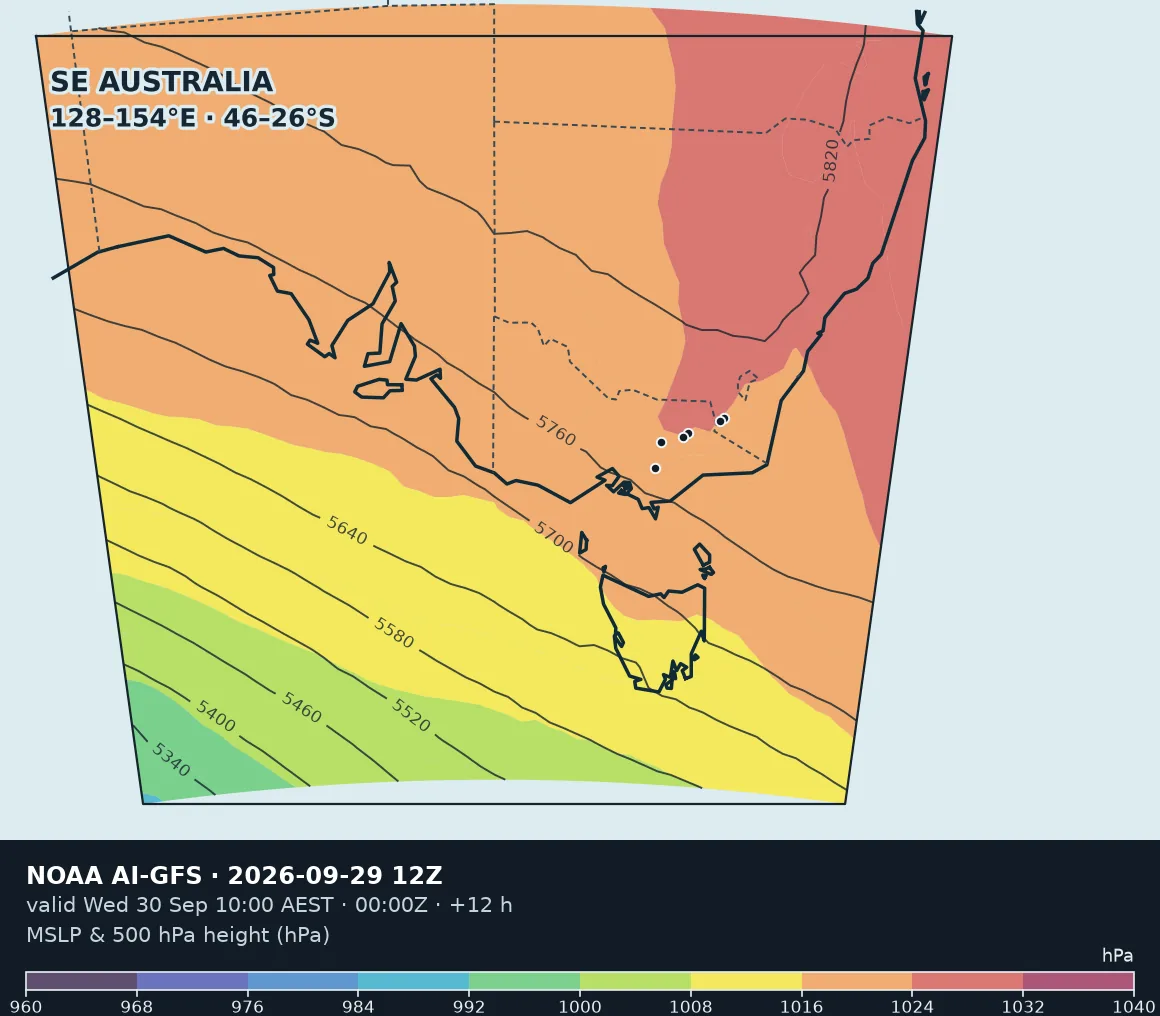
The coloured bands are mean sea-level pressure — the surface pattern, where the highs
and lows sit. The contour lines over them are 500 hPa geopotential height: the height
of the mid-troposphere, which is what steers surface systems and carries the cold air.
Read the two together. Surface lows travel roughly along the 500 hPa flow, and a
surface low with no supporting trough aloft usually fills and goes nowhere. A deep
Z500 trough with a surface low beneath it is a system with somewhere to go.
What a snow-bearing pattern looks like here
For the Australian alps the classic setup is a deep 500 hPa trough over the
Bight swinging east, with a surface low tracking through Bass Strait or just
south of Tasmania and a cold front sweeping the ranges behind it. The snow comes with
the post-frontal south-westerly flow, not with the front itself.
A blocking high in the Tasman is the pattern that ruins a week: it
stalls the westerlies and pushes fronts south of the continent entirely. A
cut-off low — a closed Z500 circulation detached from the westerly
belt — can deliver a lot of snow or nothing at all depending on exactly where it sits,
and is precisely the feature ensemble means smear out worst.
Using the systems against each other
These are independent forecasts from independent models. Where they agree
on the pattern at day seven, that is real signal. Where they disagree — a trough in a
different place, a high in a different place — the honest reading is that the pattern
is not yet resolved, and no amount of staring at any one panel will settle it.
They are also not equally constructed, and the caption under each frame says which is
which. The ECMWF panel is a mean this project calculates from the 50 raw perturbed
members, because ECMWF's open data publishes no mean product. The GEFS panel is NOAA's
own official geavg mean.
NOAA AI-GFS is not an ensemble at all. It is a single deterministic
run, so it is not smoothed the way the other two are — and it has no members to
disagree, which is why it has no panel on any of the spread views. Nothing
deterministic is ever drawn under a spread scale here.
850 hPa temperature
850 hPa is roughly 1,500 m — above the boundary layer, so it shows the airmass rather
than local surface effects. It is the standard field for judging whether the air behind
a front is genuinely cold.
It is a pressure surface, not a fixed height, and its altitude moves with the
atmosphere. It is not a thermometer at a lift, and this page does not convert it into
one. For snow level at a named resort elevation, use the 0–3 day vertical structure
pages, which do the pressure-aware wet-bulb work properly.
What these maps deliberately do not do
- They are not anomalies. Nothing here is expressed against a climatology.
-
No pixel is ever sampled into a resort number. Map guidance and point values stay
separate throughout this app. The six dots on the ranges are Perisher, Thredbo,
Falls Creek, Mt Hotham, Mt Buller and Mt Baw Baw, north-east to south-west. They
are deliberately unlabelled: at this scale Falls Creek and Mt Hotham are three
pixels apart, and a name at each would cost more of the map than it returned. They
locate the pattern against a mountain you know, and nothing is read off the map at
them — each dot spans tens of kilometres of terrain under a fifty-member mean. For
numbers at an elevation, the
0–3 day vertical structure pages do the pressure-aware work.
-
Precipitation and snowfall are shown as 12-hour
increments, because the two systems accumulate differently and only a matched
interval is comparable.
-
Snowfall is ECMWF-only. Neither GEFS nor NOAA AI-GFS publishes an accumulated-snowfall field on this
product, and its snow-on-ground record is a different quantity, so it is not
substituted.