Seasonal — the drivers behind the pattern
Nothing on this page forecasts a day. These are the background conditions that make a run of fronts more or less likely over a fortnight to a season, and they are the context the 3–7 day charts sit inside.
CPC historical Southern Annular Mode (SAM / AAO)
Monthly historical index, 1979–present · southern winter months highlighted
Latest — Aug 2026: -0.62 — negative — leans favourable for alpine fronts · winter (Jun–Aug 2026) mean + 0.76
negative, winter (favourable) positive, winter other months
BoM Southern Hemisphere Monitoring
Current official ENSO, IOD and SAM monitoring
Official monitoring context, linked at source. This page deliberately does not republish the Bureau’s written commentary. Open Southern Hemisphere Monitoring.
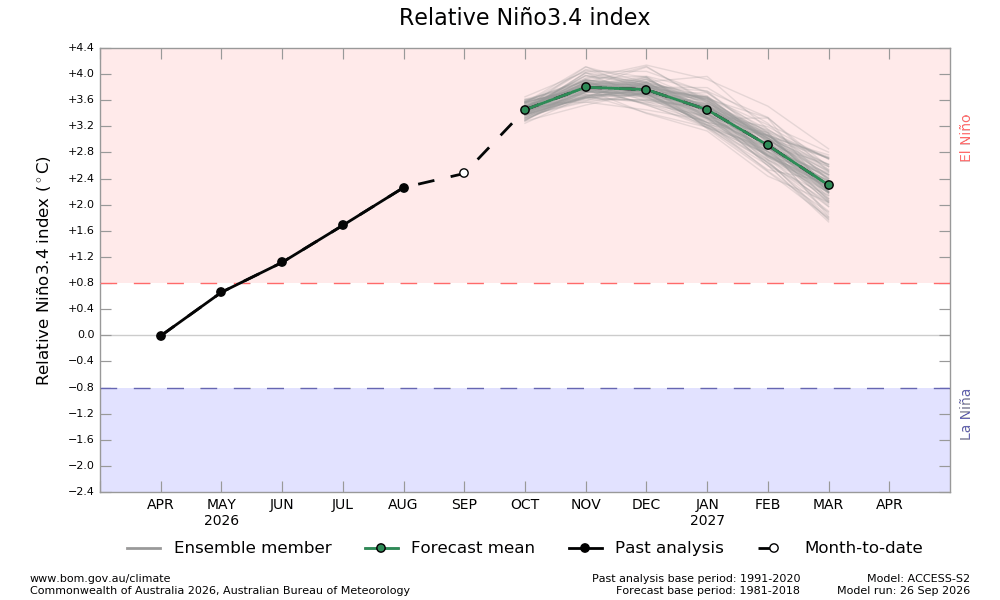
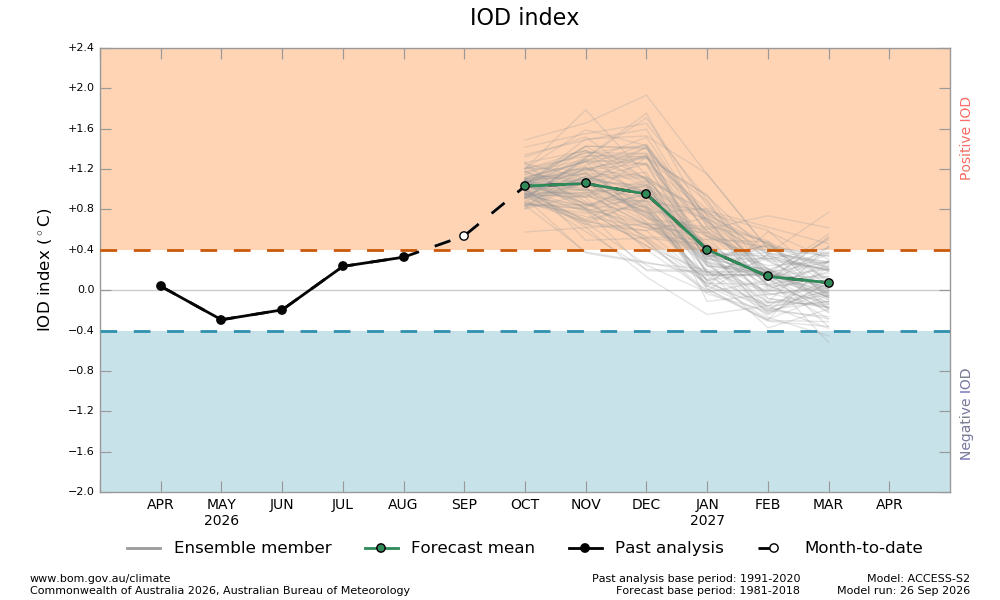
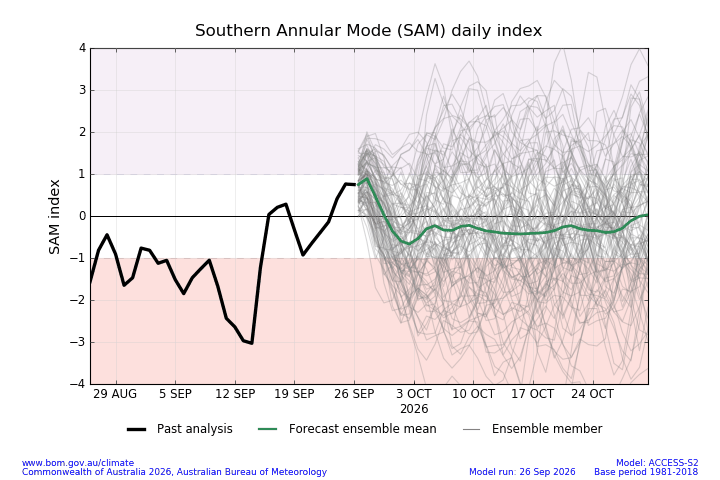
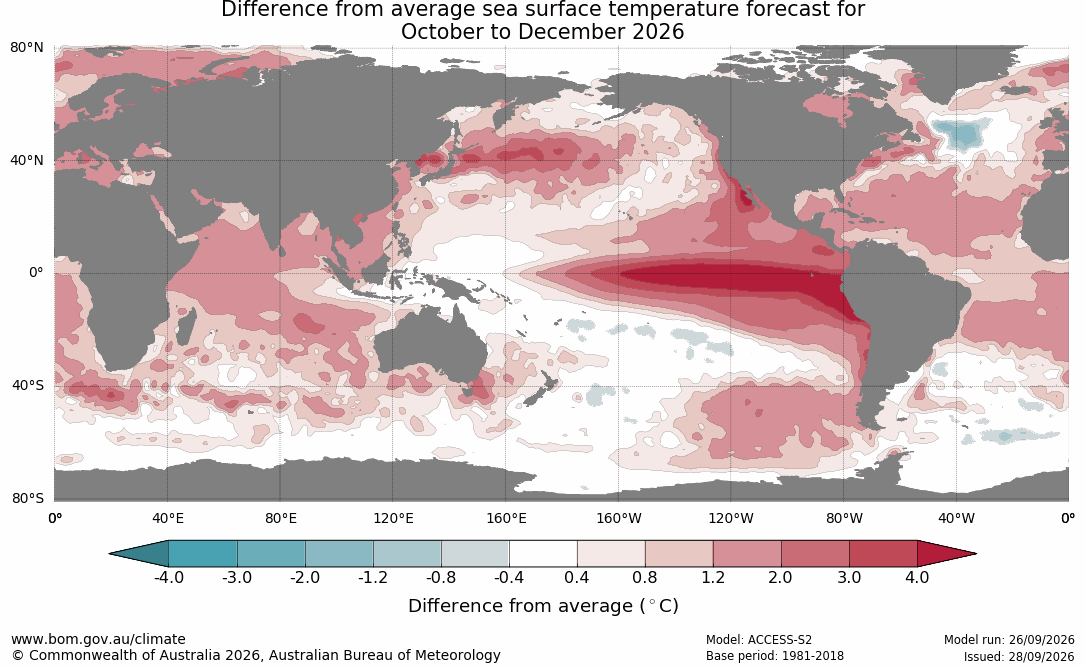
BoM ACCESS-S outlook scenarios
These are BoM’s forecast scenarios. They are distinct from the CPC historical SAM index above: the BoM SAM graphic is an ACCESS-S forecast, while the CPC chart is observed history.
Not shown here, and why
These seasonal sources exist and we can reach them. What is unresolved is whether we may republish them — a licensing question, not a technical one. Each links out to the origin, which is where the community reads them today anyway.
- BoM SAM (Southern Annular Mode) page — none — BoM default terms; page carries no CC BY notice