500 hPa height anomaly

The same producer as the SE-Australia synoptic maps, wider domains: the whole hemisphere, pole at centre, or an Australia-wide regional box roughly matching the familiar deterministic charts. Same ensemble-mean caveats apply — read the pattern, not the position.

Current product 02 Aug 2026, 00:00 UTC run · retrieved 1 min ago · 9 frames from +120 h to +216 h
This refreshes on a schedule; the cycle age above is the authority on what you are seeing. To fetch a cycle immediately: npm run synoptic:refresh -- --views core-anomaly

The whole hemispheric steering pattern, pole at centre — where the circumpolar flow is troughing or blocking relative to normal for the date.

+120 h · valid 07 Aug 2026, 00:00 UTC · Fri, 07 Aug, 10:00 AEST

Systems shown
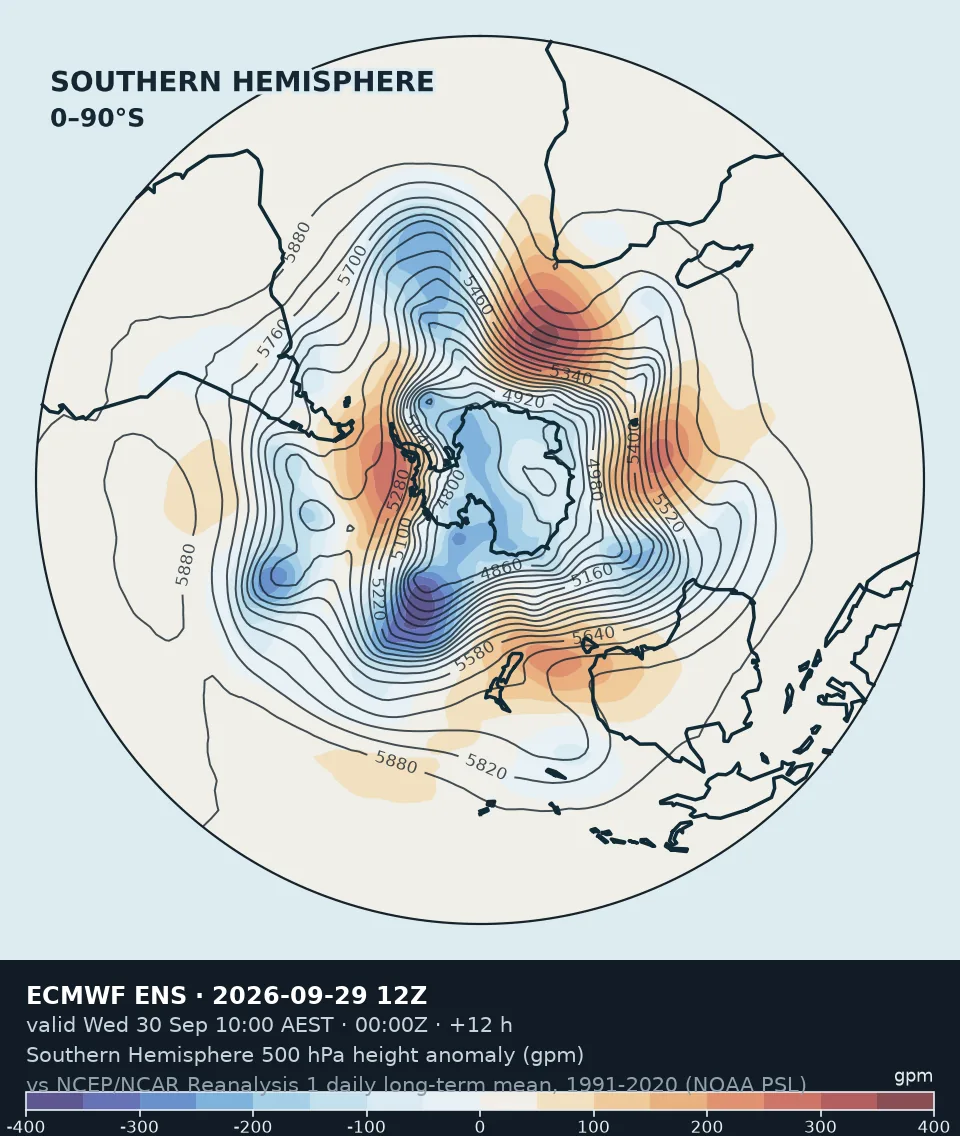
Southern Hemisphere 500 hPa height anomaly — ECMWF ENS · calculated available-member mean · run 02 Aug 2026, 00:00 UTC · +120 h · 0.25° regular latitude–longitude, valid 07 Aug 2026, 00:00 UTC.
ECMWF ENS · calculated available-member mean · run 02 Aug 2026, 00:00 UTC · +120 h · 0.25° regular latitude–longitude
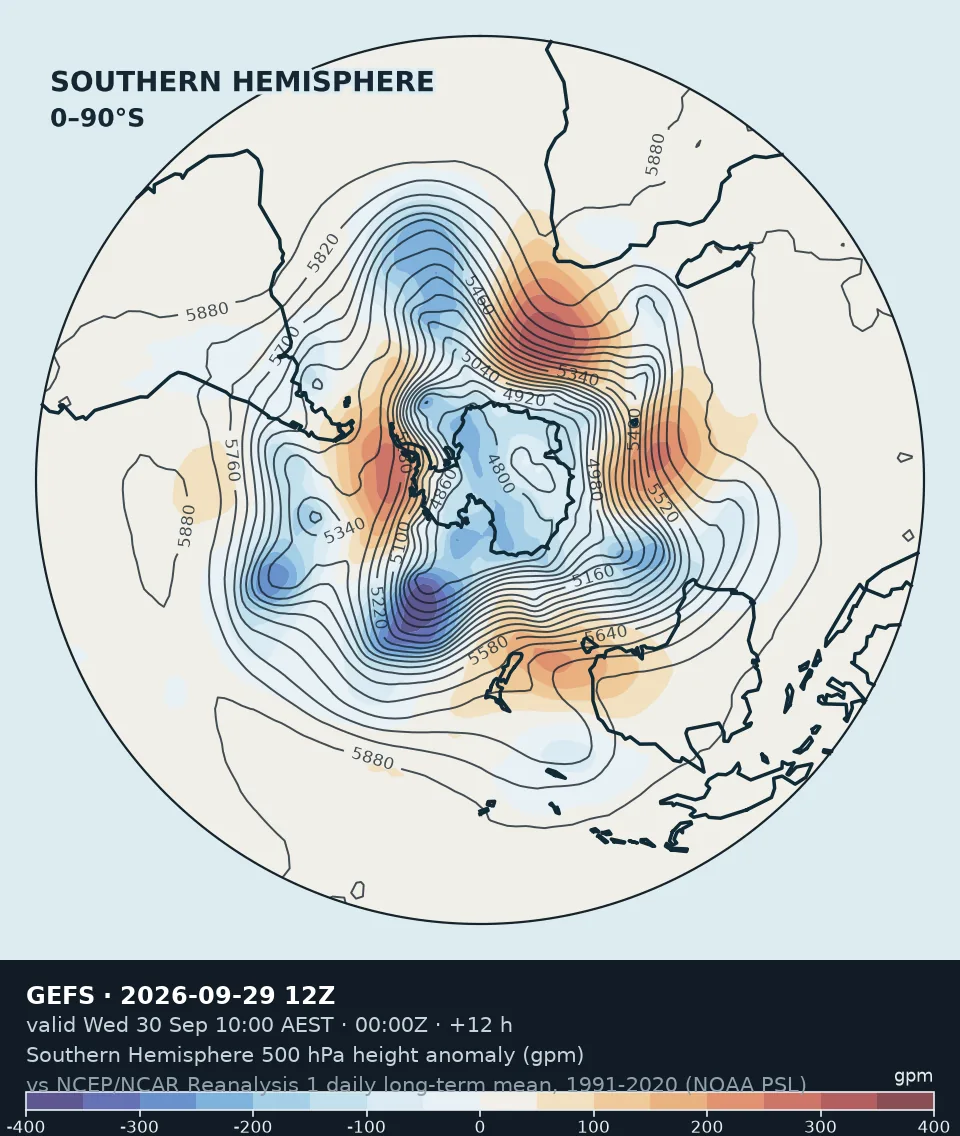
Southern Hemisphere 500 hPa height anomaly — GEFS · official ensemble mean (GEFS geavg) · run 02 Aug 2026, 00:00 UTC · +120 h · 0.50° regular latitude–longitude, valid 07 Aug 2026, 00:00 UTC.
GEFS · official ensemble mean (GEFS geavg) · run 02 Aug 2026, 00:00 UTC · +120 h · 0.50° regular latitude–longitude

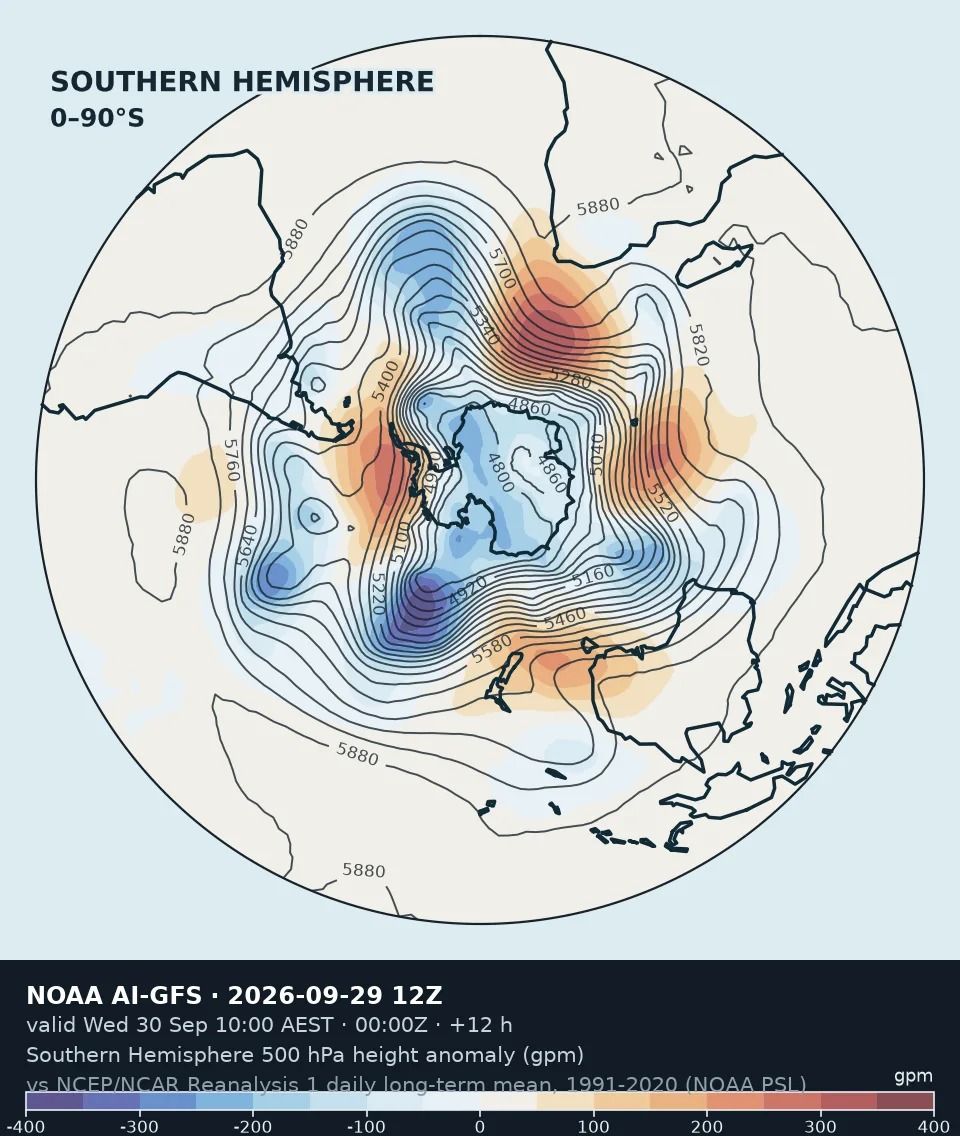
Bands departure from the 1991-2020 daily normal, -400–400 gpm in 50-gpm intervals; 500 hPa geopotential height contours 4800–6000 gpm, 60 gpm

Use the slider, the arrow buttons, or Left/Right Arrow while the slider is focused. Frames are discrete model steps 12 hours apart — nothing is interpolated between them.

How to read these maps

Same anomaly, two frames of reference

Both views are the same 500 hPa height anomaly as the SE-Australia panel — forecast height minus the 1991-2020 daily normal for that date — drawn over a wider extent instead of one corner of it. Deep blue is a trough digging further than normal, deep red a blocking ridge. Each domain gets its own colour scale, chosen for the anomalies it actually reaches: the hemispheric view runs to ±400 gpm near the pole, the Australia-wide view to ±280 gpm.

Why the wider views matter

The SE-Australia panel is a window onto one part of the circumpolar westerly belt. A blocking high sitting in the Tasman, or a trough digging from well south of the continent, often only makes sense in the context of the whole wave pattern — the hemispheric view — or the whole continent's response to it — the Australia-wide view — neither of which the regional panel alone shows.

Why this differs from the familiar chart

The Australia-wide view resembles the deterministic ECMWF "500 mb height & anomaly" charts published elsewhere, but is not the same product: this is the 50-member ENS mean, not the single HRES deterministic run — the more honest product for a lead this far out, where a single run's exact position is not something to read literally. The baseline is NCEP/NCAR Reanalysis 1991-2020, not the CFSR 1981-2010 period those charts typically use, and heights are in geopotential metres (gpm), not decametres (dam).